

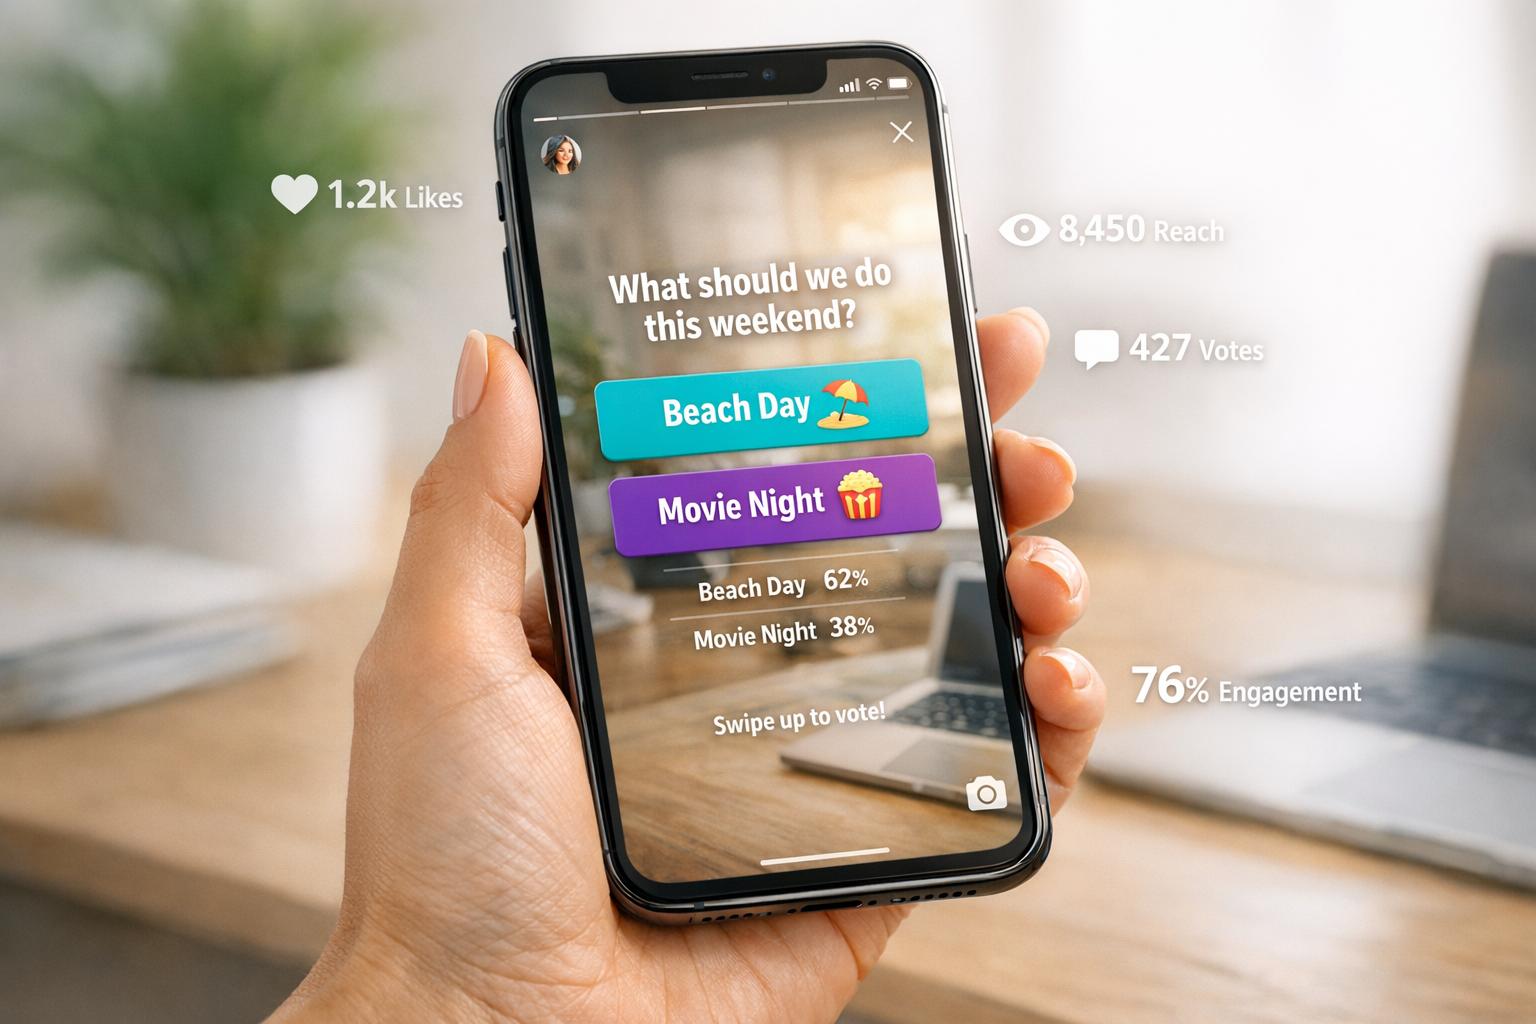
Instagram polls are one of the easiest ways to interact with your audience and gather feedback. Measuring poll engagement helps you understand what your followers care about while boosting your visibility using the best Instagram growth services. Here's what you need to know:
- Poll Metrics to Track: Focus on reach (unique viewers), impressions (total views), poll responses, response rate, and completion rate if your poll is part of a multi-slide Story.
- Accessing Poll Data: Use Instagram Insights or the Archive section to view metrics like total votes, percentage breakdowns, and user demographics. Remember, you only have 24 hours to see who voted for what.
- Improving Engagement: Test different poll formats, time your posts strategically, and place polls in the middle of Story sequences to keep viewers engaged.
- Using Insights: Analyze audience demographics and voting patterns to make informed decisions for marketing campaigns. Polls can also help you understand preferences for product development or ad targeting.
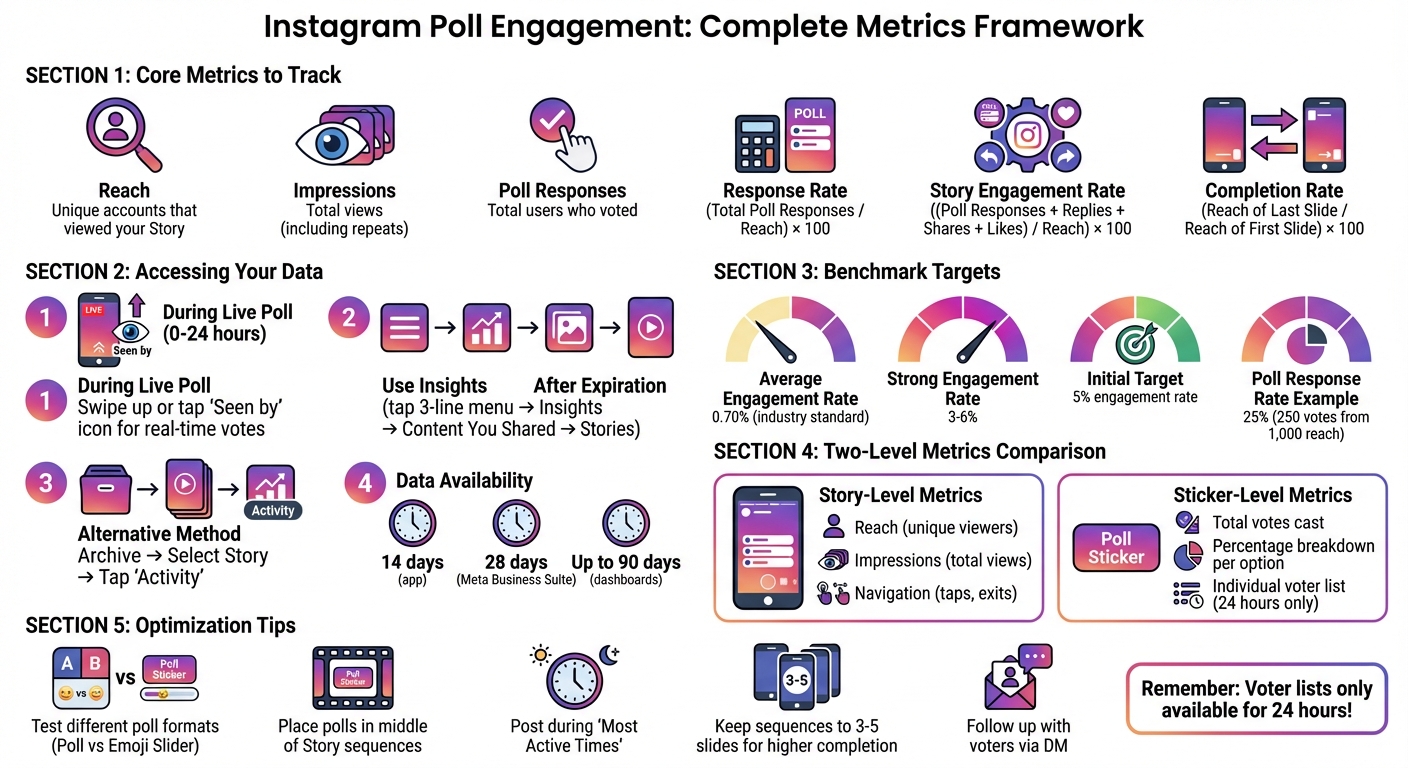
Instagram Poll Engagement Metrics: Key Tracking Framework
How to Access Instagram Poll Metrics
Finding Poll Metrics in Stories
When your Instagram poll is live, you can check real-time vote counts by swiping up or tapping the "Seen by" icon on your Story screen. Once the poll expires, you can still access its data by using the Insights feature or the Archive section in your profile.
To access Insights, tap the three-line menu in the top-right corner of your profile, select "Insights", and navigate to "Content You Shared." From there, choose "Stories" to filter past content by metrics like "Story Interactions". Alternatively, you can open the "Archive" from your profile menu, select the specific Story, and tap "Activity" in the bottom-left corner to view detailed engagement data.
This quick access to metrics allows you to gauge engagement while the data is still fresh and actionable, or use Instagram growth services to scale your reach further.
Story-Level vs. Sticker-Level Metrics
Once you've located your data, it's important to differentiate between overall Story performance and poll-specific interactions.
-
Story-level metrics give you an overview of how the entire Story slide performed. This includes:
- Reach: The number of unique accounts that viewed your Story.
- Impressions: The total number of views, including repeat views.
- Navigation: Actions like forward taps, backward taps, and exits.
-
Sticker-level metrics, on the other hand, focus solely on the poll. These metrics include:
- Total votes cast.
- Percentage breakdown for each poll option.
- A detailed list of users who voted for each option.
To view poll-specific details, use the "eye" icon for individual sticker data and the "graph" icon for overall Story performance.
How Long Poll Data Remains Available
Instagram provides detailed Story insights in the app for 14 days, while Meta Business Suite on desktop extends this window to 28 days. Some dashboards even offer access to Story metrics for up to 90 days, with certain data archived for as long as two years.
However, if you need to see exactly which users voted for specific poll options, you'll need to capture this data within the first 24 hours. After that, voter lists become less accessible, leaving only aggregate percentages.
"Instagram Stories last a mere 24 hours - here today, gone tomorrow. But just because these pieces of content disappear doesn't mean they can't have a lasting impact on your audience." – Stacey McLachlan, Hootsuite
sbb-itb-3858882
Key Metrics for Measuring Poll Engagement
Core Metrics to Track
When analyzing your poll data, there are four key metrics that can provide valuable insights into how your audience interacted with your content.
Reach refers to the number of unique accounts that viewed your Story featuring the poll. This metric shows how many individual viewers, including those beyond your followers, saw your content. Impressions, on the other hand, count the total number of times your Story was displayed. For instance, if someone watches your Story twice, it counts as two impressions but only one reach. To gauge how often the average viewer saw your content, divide the total impressions by the reach.
Poll Responses measure the total number of users who interacted with your poll sticker. The key figure here is the Poll Response Rate, which you can calculate using this formula:
(Total Poll Responses / Reach) × 100.
This percentage reflects how many viewers who saw your poll actually voted, providing insight into your poll's relevance and accessibility.
For example, if your Story reached 1,000 accounts and 250 users participated, your response rate would be 25%, meaning one out of every four viewers engaged with your poll.
In addition to poll votes, it’s essential to evaluate broader engagement metrics to get a complete picture of how users interacted with your Story.
Story Engagement Rate for Polls
To assess your Story's overall performance, including but not limited to poll responses, calculate the Story Engagement Rate using this formula:
((Poll Responses + Replies + Shares + Likes) / Reach) × 100.
This metric provides a well-rounded view of audience interaction by factoring in all types of engagement. While engagement rates between 3% and 6% are generally considered strong, the industry average tends to be around 0.70%. Using reach instead of follower count ensures more accurate results, as not all followers view every Story.
Beyond direct interactions, it’s also important to measure how well viewers stayed engaged through sequential content using the completion rate.
Completion Rate of Stories with Polls
If your poll is part of a multi-slide Story sequence, the Completion Rate helps determine whether viewers stuck around until the final slide. This is calculated as:
(Reach of Last Slide / Reach of First Slide) × 100.
For example, if the first slide of your sequence reached 152 accounts and the last slide reached 108, the completion rate would be 71%. This means 29% of viewers dropped off before finishing the sequence. A high completion rate suggests your poll and accompanying content kept viewers engaged. Shorter sequences, typically 3–5 slides, tend to maintain higher retention rates. Placing your poll in the middle of the sequence can further improve viewer retention.
Using Poll Insights for Marketing Decisions
Analyzing Audience Demographics
Once you've collected responses from your polls, the next step is figuring out who is engaging with your content. With a professional Instagram account, you can access demographic details like top countries, cities, age ranges, and gender breakdowns through Instagram Insights. However, this data becomes available only after your account has reached at least 100 unique accounts within your selected timeframe. To hit that threshold, consider extending your timeframe to 30 or even 90 days.
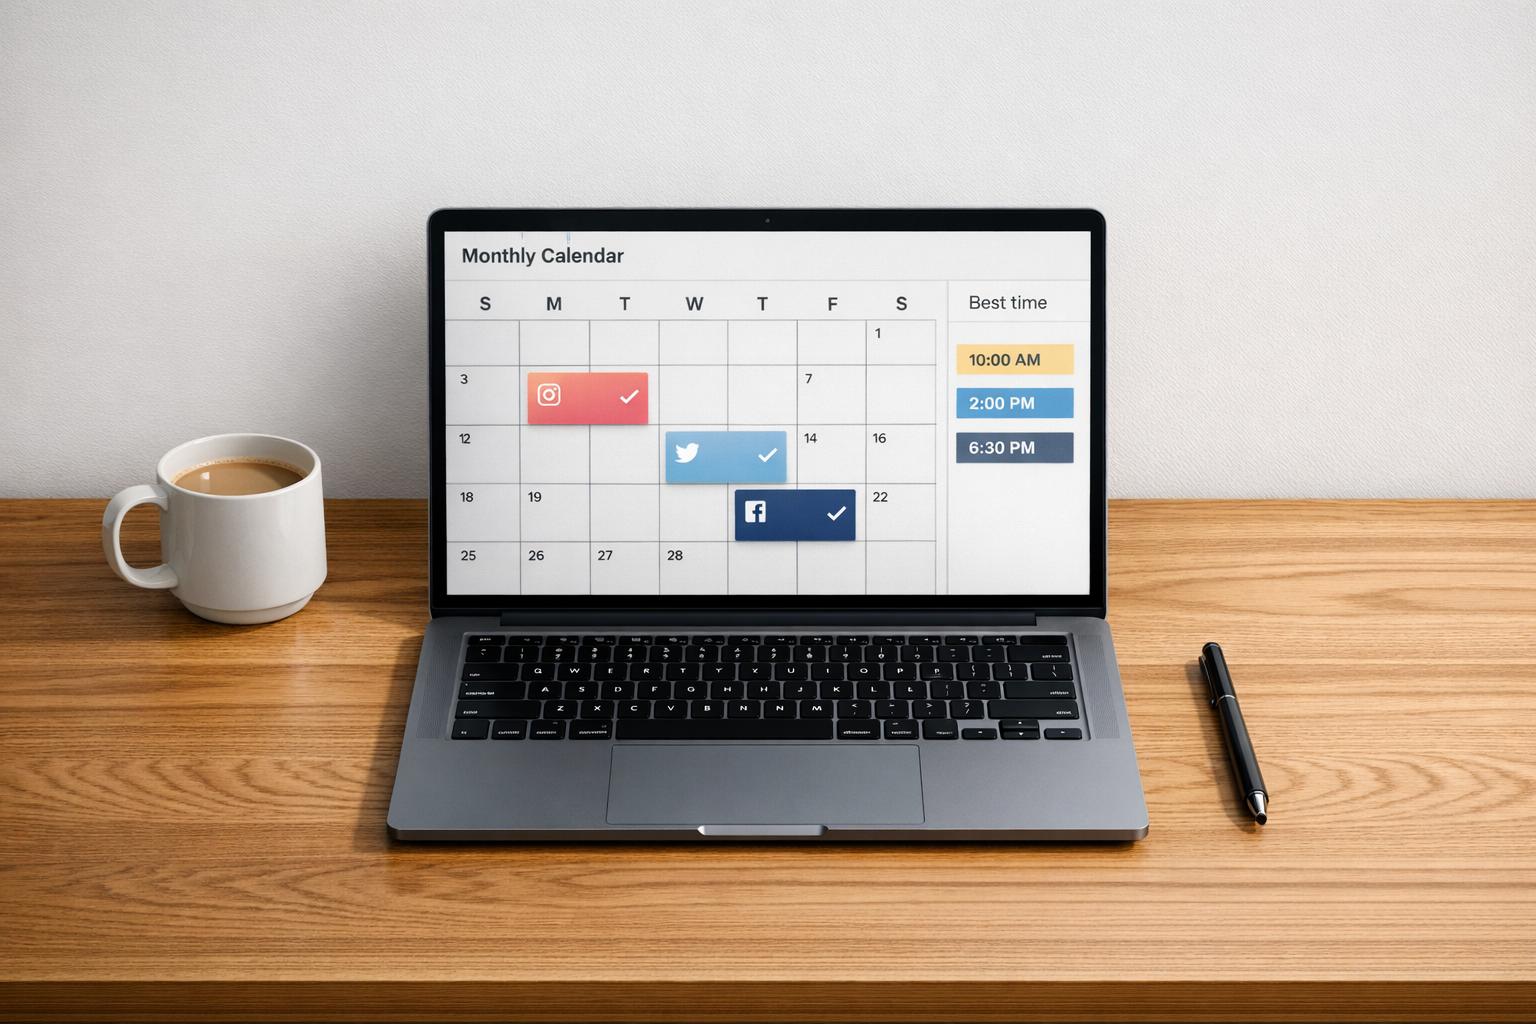
To dive deeper into the details, swipe up on an active Story or tap the "Seen by" icon to see who participated. Compare metrics like "Accounts Reached" versus "Accounts Engaged" to spot gaps - for example, if women aged 25-34 are viewing your polls but not voting. Use the "Most Active Times" feature to time your polls strategically, ensuring they go live when your audience is most likely online. If you're running poll ads, the "View Charts" option in Ads Manager provides a demographic breakdown of performance and interaction results.
These insights can help you uncover actionable trends in your audience's behavior.
Identifying Patterns and Trends
Poll results can provide valuable direction for your future campaigns, as shown by brands like Swarovski and Farm Rich. Swarovski used Instagram Story poll ads to ask followers about their color preferences for a new jewelry collection. The feedback guided their decisions on which products to prioritize in email campaigns and organic content across other platforms. Similarly, Farm Rich ran poll ads during the 2020 Super Bowl weekend to gauge snack preferences, keeping their brand relevant during a busy shopping period.
Look for recurring themes in your poll responses. For example, if "This or That" polls consistently show followers leaning toward one product feature, use that information to refine product development or ad creatives. Reggie, a dog wellness brand, uses polls to gather input on their products. CEO Josh Weiss explains:
"If users see that their votes are having a tangible impact, they're more likely to engage with the poll".
You can also retarget users who interacted with specific poll options by creating custom audiences and offering tailored promotions that align with their choices.
Once you've identified trends, it's essential to track how these insights translate into measurable outcomes.
Tracking Actions from Poll Engagement
To measure the effectiveness of your polls, monitor metrics like profile visits, website clicks, follows, and even business location taps. These actions help determine whether poll engagement is driving real business results. For instance, if a poll about a new product generates a lot of votes but few website clicks, it might be time to rethink your call-to-action.
Social media experts Laura Moore and Laura Davis, co-founders of The Two Lauras, emphasize the importance of follow-up:
"Instagram polls are a great way of collecting useful data, so make sure you can follow up with the respondents afterward".
Consider reaching out to poll participants directly via DMs, especially those who voted for a specific product or expressed interest in a topic. This personal approach can turn casual interactions into meaningful leads.
Improving and Benchmarking Poll Performance
Creating Internal Benchmarks
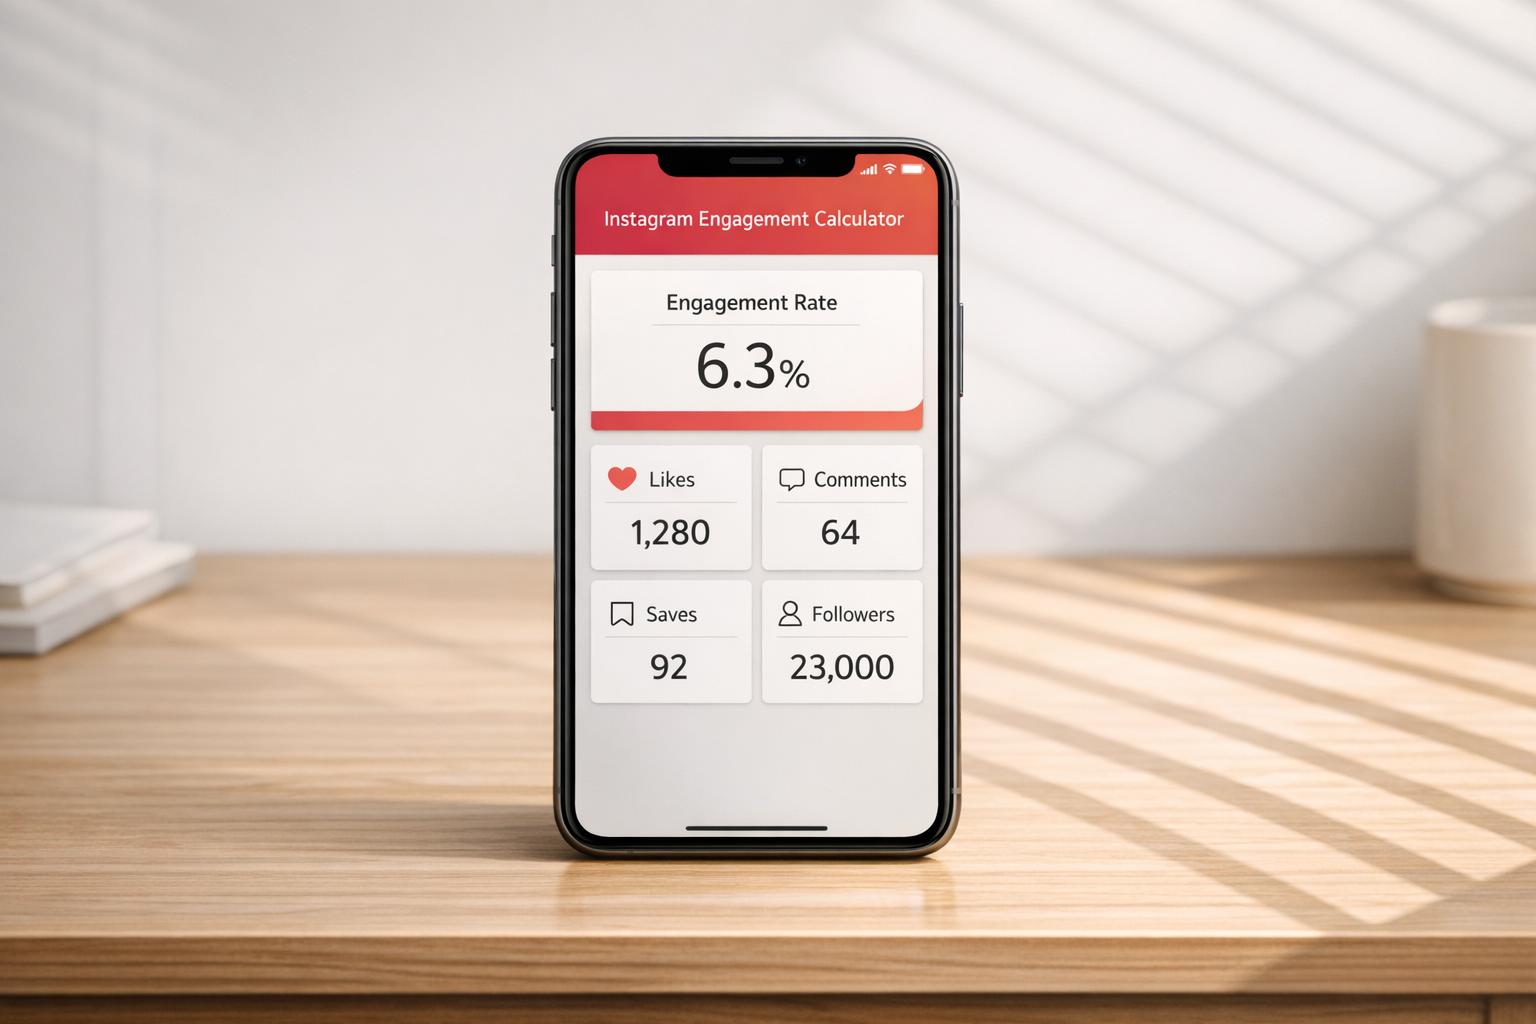
To track how your polls are performing, you need a baseline to measure against. A good starting point is analyzing the past 30 days of data using tools like Meta Business Suite. This will help you understand your typical interaction levels. For a more accurate picture, calculate your Engagement Rate based on Reach (ERR). This involves dividing the total interactions by the number of people who actually viewed your Story - not just your follower count. It’s a great way to spot seasonal trends and refine your campaign strategies. When it comes to polls, focus on the Response Rate, which is calculated by dividing the total poll votes by the Story reach.
On average, Instagram’s engagement rates hover between 3% and 6%, while cross-industry benchmarks are closer to 0.70%. Use these as loose guidelines and aim for an initial 5% engagement target. As you gather more data, adjust this benchmark to better suit your account. To dig deeper, compare your averages month-over-month and break down results by content type or audience demographics. This can help you figure out what really clicks with your followers.
A/B Testing Poll Variations
Trying out different poll formats can uncover what resonates most with your audience. For instance, Rachel Macfarlane boosted poll engagement by about 48% simply by spending 15 minutes interacting with her audience before posting. You can experiment with the standard Poll sticker, which offers clear choices, versus the Emoji Slider, which gauges emotional intensity. Play around with how you phrase your questions, such as comparing specific ones like “Which color do you prefer?” to broader queries, to see which gets more responses.
Placement also matters. Position your poll stickers near the center of the screen to avoid interference from Instagram’s UI or accidental taps. Another idea is to use a short video introduction to explain your poll instead of a static image, and then track which approach leads to more completions. If you’re running poll ads, create separate ad sets with “Instagram Stories” as the only placement, since polling stickers won’t work with automatic placements. And remember, keep poll options positive - people are less likely to engage if the choices make them feel uncomfortable. Stay consistent with testing and adapt as Instagram rolls out new features.
Staying Updated with Instagram Changes
Instagram frequently updates its features and metrics, so staying informed is key. For example, the platform recently replaced “impressions” and “plays” with a universal “views” metric across all content types, changing how engagement is measured. Poll stickers, too, have evolved - they now allow up to four answer options instead of just “Yes/No” and can be used in both Stories and Reels.
To stay ahead, follow sources like AdWeek for updates on new features or algorithm tweaks that might impact your polls. Knowing that Instagram’s Stories algorithm prioritizes timeliness and engagement can help you time your polls more effectively. Make it a habit to check your Professional Dashboard regularly, so you’re aware of any real-time changes in how your data is displayed and categorized.
How to use the Instagram poll feature to increase engagement
Conclusion
Tracking Instagram poll engagement offers valuable insights into your audience's preferences and behaviors. By focusing on key metrics - like reach, response rates, and the breakdown of poll options - you can better understand what your followers care about most. This shifts your brand from simply sharing content to actively building a more engaged and interactive community.
Poll data does more than inform - it works with Instagram’s algorithm to show that users are engaging with your content. This can improve your position in the Stories queue and increase overall feed visibility. Beyond that, these statistics open doors for meaningful conversions.
One standout feature of Instagram polls is the ability to see exactly who voted for each option. This provides a unique chance to segment your audience and follow up directly. As Laura Moore and Laura Davis from The Two Lauras explain:
"Instagram polls are a great way of collecting useful data, so make sure you can follow up with the respondents afterward".
Using this data, you can initiate direct conversations through messages, turning poll participants into potential customers.
To maximize success, consistency and flexibility are key. Regularly review your poll performance, set benchmarks, and experiment with different approaches to find what clicks with your audience. Josh Weiss, Founder and CEO of Reggie, emphasizes:
"If users see that their votes are having a tangible impact, they're more likely to engage with the poll".
FAQs
How can I boost engagement on my Instagram polls?
To get more people involved in your Instagram polls, start by asking clear and fun questions that click with your audience. Think about using trending topics, relatable situations, or lighthearted comparisons like “Pizza or Burgers?”. Make the poll options interesting and catchy, and pair them with visually appealing content - bright photos, playful graphics, or short, engaging videos. Adding emojis, quirky text, or a simple call-to-action like “Tap to vote!” can make your poll even more inviting.
After your poll is up, timing and experimentation are key. Share your poll when your audience is most active - weekday evenings or weekend mornings are usually good bets. Play around with different elements, such as the wording of your question or the style of your background, and keep an eye on metrics like how many people see it and how many respond. Test these variations over a week or two to see what works best. Once the poll wraps up, share the results with your followers, thank them for participating, and consider asking a follow-up question to keep the conversation alive. This not only keeps your audience engaged but also helps Instagram recognize your content as interactive and engaging.
What are the key metrics to evaluate the success of Instagram polls?
To measure how well your Instagram polls are performing, keep an eye on these important metrics:
- Impressions: This shows how many times your poll was viewed overall.
- Reach: The number of unique users who saw your poll.
- Engagement Rate: The percentage of viewers who participated by voting in your poll.
- Story Completion Rate: The percentage of users who watched your story from start to finish.
- Click-Through Rate (CTR): If your poll includes a link, this tracks how many users clicked on it.
By monitoring these numbers, you can understand how effective your polls are and how engaged your audience is. Regularly reviewing these insights can help you fine-tune your Instagram approach over time.
How long can you access Instagram poll data for analysis?
Instagram poll results don’t vanish completely after 24 hours - they’re saved in your Stories archive. While the poll itself is only visible to your audience for a day, you can revisit the results anytime. Just head to your archive to check out details like responses and engagement whenever it suits you.


![Outfame Review – The Best Instagram Growth Service in 2026 [TESTED]](/cdn-cgi/image/fit=contain,format=auto,width=null/https://cdn.prod.website-files.com/67840d1d88a886f29a66a4c1/699476a6ce95840f57a98e14_outfame-homepage.png)


![Top 7 Best Instagram Growth Services in 2025 [RESULTS]](/cdn-cgi/image/fit=contain,format=auto,width=null/https://cdn.prod.website-files.com/67840d1d88a886f29a66a4c1/6795d12917ee4501b9eddf73_6795c731964f791db3b566c4-1737870861582.jpg)
![UpGrow Review – The Top Instagram Growth Service in 2026 [UPDATED]](/cdn-cgi/image/fit=contain,format=auto,width=null/https://cdn.prod.website-files.com/67840d1d88a886f29a66a4c1/6795040db42e404207732526_6794fd9c964f791db3b48de9-1737818779111.jpg)